

Continuous Process Improvement (CPI) methodologies are well-documented and widely trained. However, figures consistently cited in peer-reviewed operations management literature place more than half of Lean transformations as failing to sustain their initial gains beyond three years. Why?
The Six Sigma DMAIC framework (Define, Measure, Analyse, Improve, Control) is also no exception to failure. Studies suggest that projects have a significantly high probability of termination specifically during the Measure and Analyse phases. Why?
Most engineers understand the mechanics of a control chart. Very few assess the systematic errors that render those charts useless.
This brief article is not a case study, but a critique of how we measure, what we ignore, and why our improvement efforts are likely failing before they begin.
The line looked stable, until it didn’t
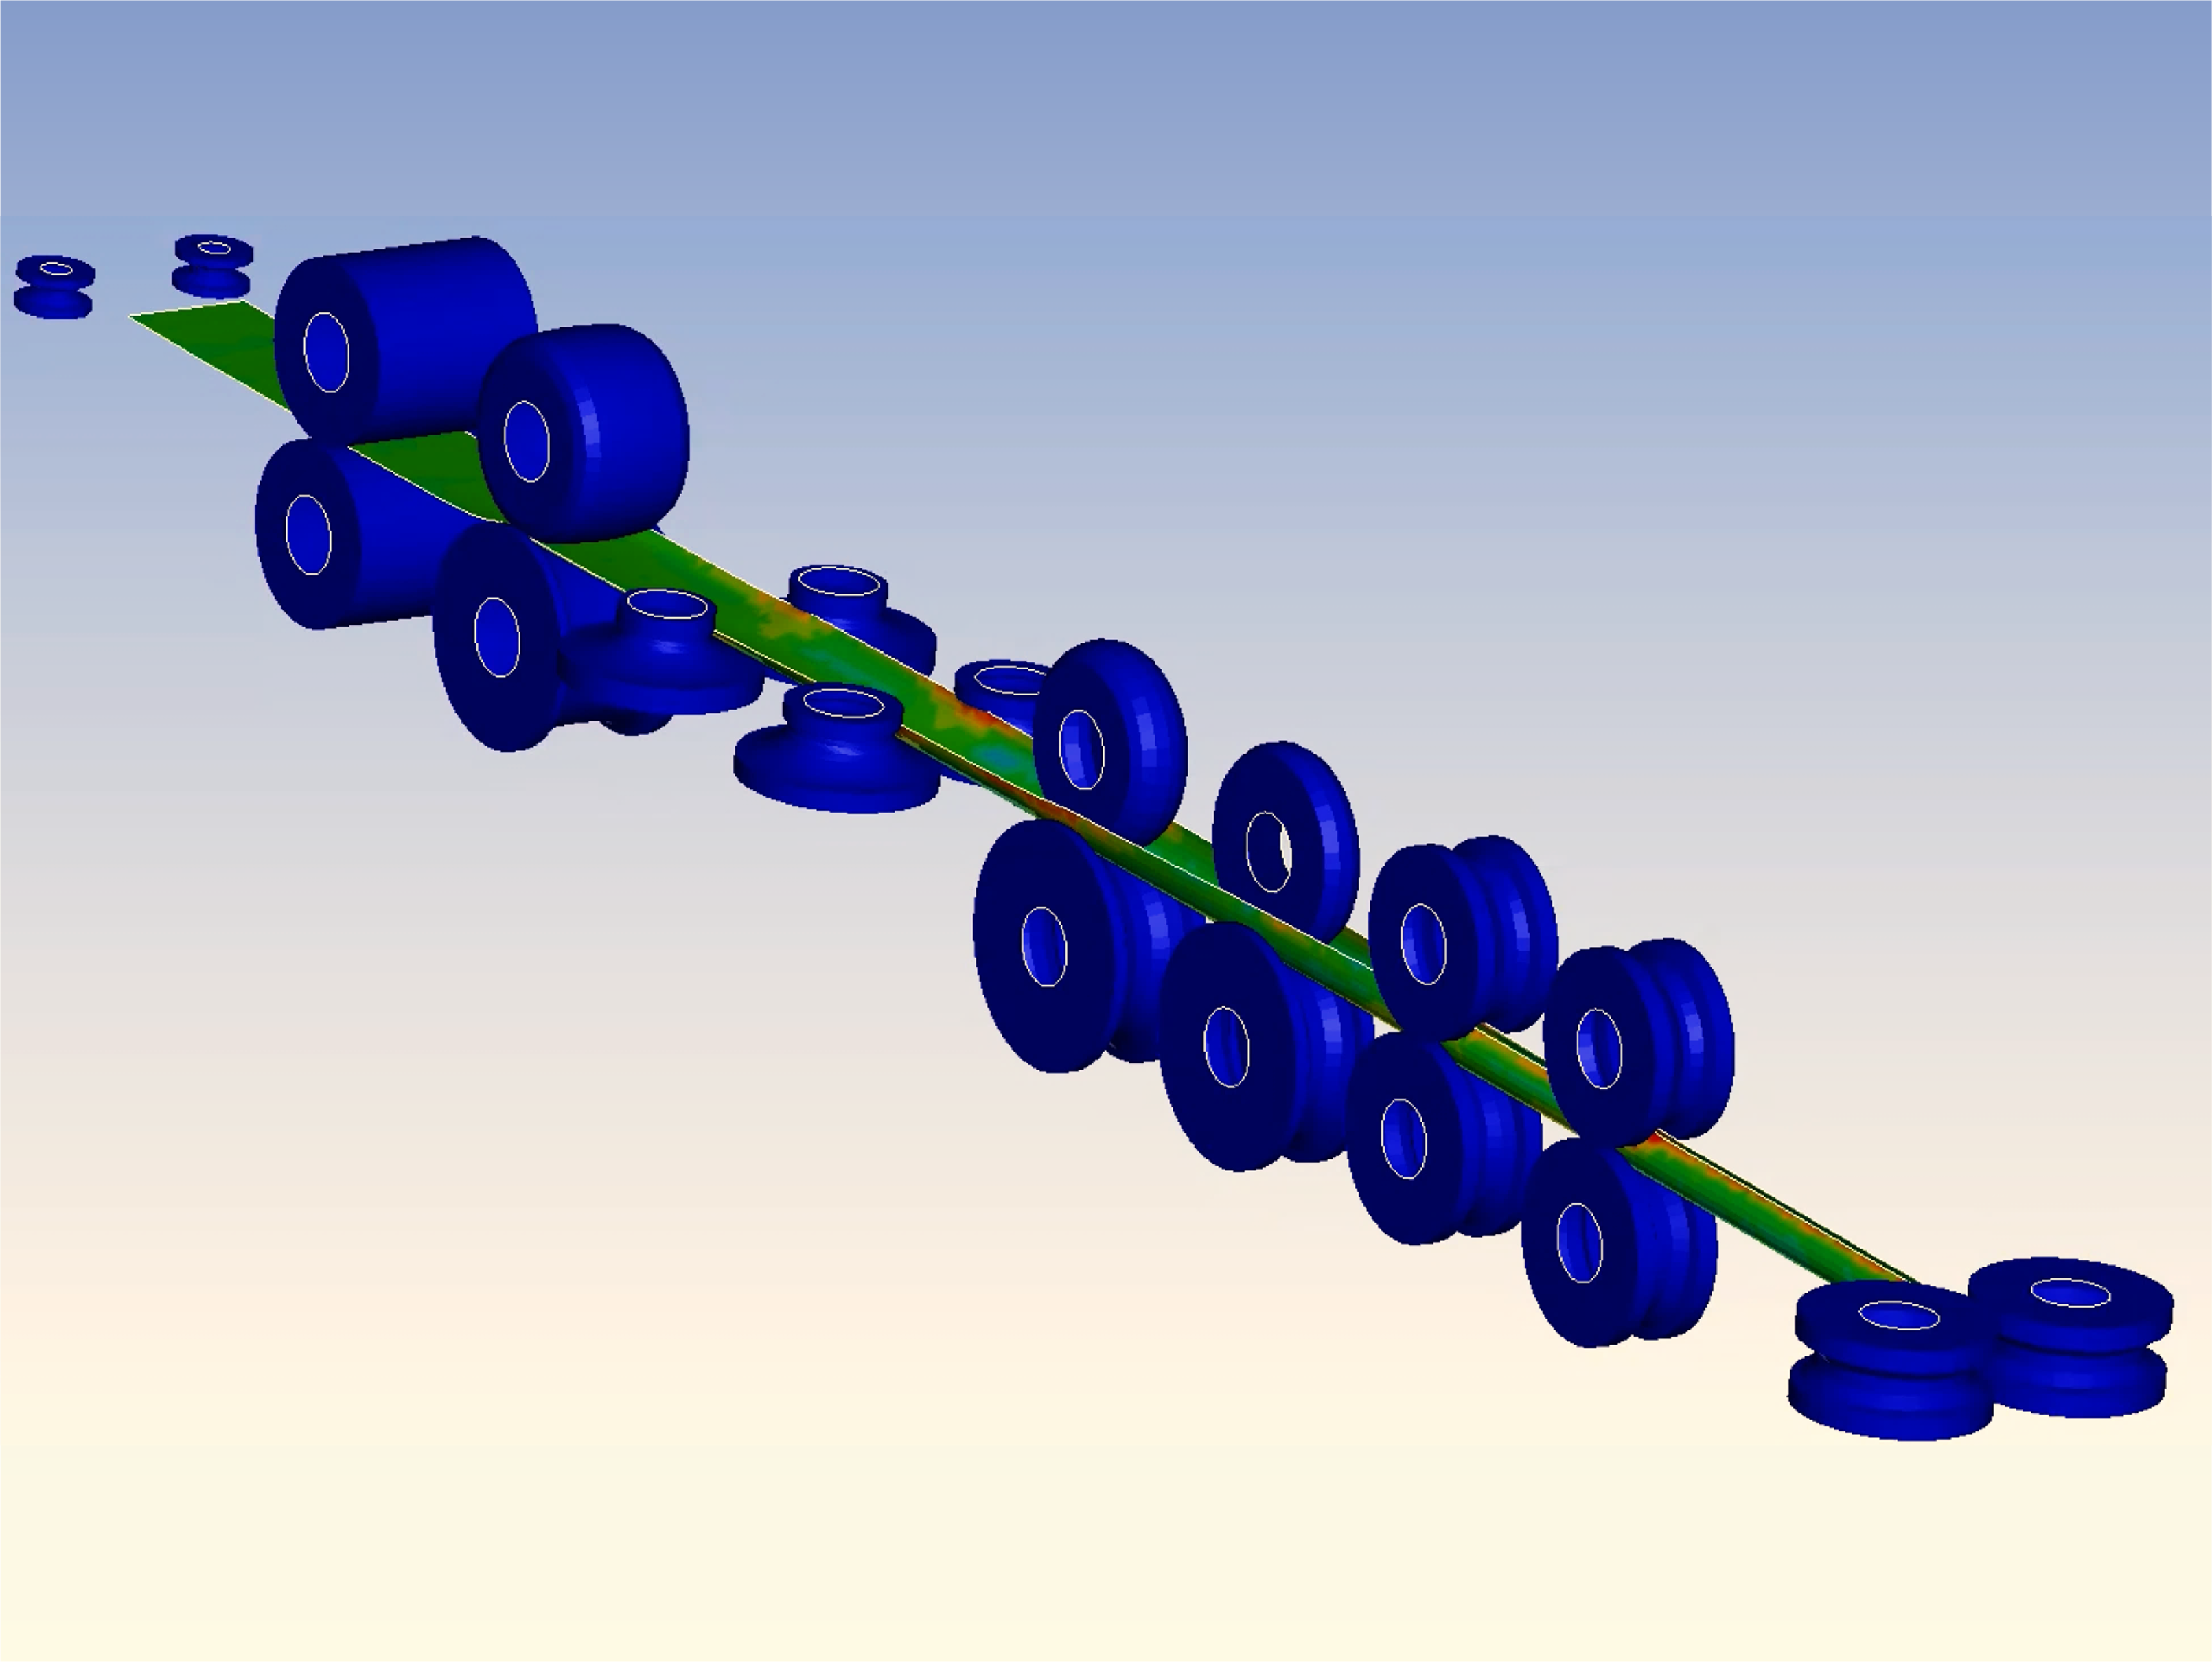
We spent part of 2026 reviewing production data from a forming line that, on paper, looked exceptionally stable. Scrap was low, Cp and Cpk were acceptable, the control charts were quiet, and the daily management boards were full of green indicators. Yet the line kept producing intermittent surface damage that nobody could explain consistently.
The operators blamed material batches. Maintenance blamed tooling wear. Quality blamed lubricant contamination. Engineering blamed operator setup variation.
All of them were partially right, which usually means nobody has identified the governing mechanism.
What eventually emerged was uncomfortable for everyone involved: the line was measuring almost everything except the variables that actually controlled failure.
That experience is hardly unique. Most Continuous Process Improvement programmes do not collapse because engineers lack knowledge of Lean, Six Sigma, DMAIC, SPC, or Root Cause Analysis. The failure usually starts much earlier, at the point where physical reality is translated into process data.
Once poor measurements enter the system, every downstream activity becomes distorted: capability analysis, dashboards, optimisation studies, even management decisions.
Factories collect enormous amounts of data, but often from the wrong variables
A large proportion of manufacturing data exists because instrumentation was easy to install, not because the parameter had first-order influence on the failure mode.
In tribological systems, this problem appears constantly. Plants routinely trend bulk oil temperature, sump temperature, nominal viscosity grade, line pressure, and flow rate. Those are convenient measurements. They are also several steps removed from the interface where damage actually occurs.
What engineers often need, but rarely have, is information related to flash temperature, asperity interaction, local film collapse, starvation behaviour, tribofilm evolution, or transient shear conditions under load reversal.
Some of these measurements are experimentally difficult. Others are expensive enough that production teams immediately reject them during budgeting discussions. So the process continues operating with surrogate variables, and over time those surrogate variables become accepted as “the process.”
The danger is not that surrogate measurements are useless. The danger is assuming they remain reliably correlated with the underlying physics under all operating conditions.
They do not.
A process can remain statistically stable while the governing contact mechanics are slowly drifting toward failure. Anyone who has investigated scuffing, micropitting, galling, or premature bearing distress has seen this happen firsthand.
Measurement systems fail quietly
The automotive sector learned this lesson repeatedly during the expansion of automated inspection in the late 1990s and early 2000s. Several manufacturers discovered that measurement system variation alone was consuming a substantial fraction of the tolerance band.
We have seen Gauge R&R studies performed during audits, then ignored operationally for years afterward. Instruments drift gradually enough that nobody notices until the process starts producing obvious failures.
One case involved displacement measurements on a mechanically loaded assembly where thermal growth during the afternoon shift altered the apparent position reading by roughly 50 microns compared with the morning baseline. The engineers initially interpreted the trend as tooling instability and kept compensating for it.
The adjustments made the process worse because much of the variation originated from the measurement chain itself.
That problem is more common than many organisations admit publicly.
The process is not always unstable, sometimes management is destabilising it
Deming illustrated this decades ago with the Funnel Experiment, yet the behaviour remains widespread in modern factories.
Operators and supervisors still react to random fluctuation as though every deviation contains actionable meaning. A line moves slightly off nominal, someone adjusts pressure or feed rate, then the next shift reverses the change because the trend moved the other way.
After several cycles, the process becomes a monument to accumulated overcorrection.
Ironically, this constant intervention is often interpreted internally as “tight operational control”. In practice, it frequently indicates the opposite: an inability to distinguish noise from assignable cause.
Traditional Shewhart charts also create a false sense of security in some environments. They are excellent for detecting large disturbances, broken tools, or abrupt offsets. They are far less sensitive to slow degradation mechanisms.
Lubricant depletion, progressive wear, thermal distortion, or sensor ageing can remain hidden for long periods while the charts continue looking acceptable.
Why simple root cause exercises often miss the real mechanism
The 5 Whys method became popular because it is simple and fast. That simplicity is also its weakness.
Complex engineering failures rarely originate from a single linear chain of causation. They emerge from interacting variables whose combined effect exceeds a critical threshold.
Tribological failures are especially unforgiving in this respect. Surface roughness, additive chemistry, contact stress, sliding ratio, contamination, temperature, and transient loading can all interact simultaneously.
A simplistic investigation usually converges on whichever explanation sounds operationally convenient.
“Operator error” remains one of the most expensive phrases in manufacturing because it often terminates technical investigation prematurely.
The same applies to lubrication-related failures. Saying “lubrication failure” explains almost nothing scientifically. Was the problem starvation? Additive depletion? Tribofilm removal? Oxidation? Viscosity collapse under shear? Surface chemistry incompatibility?
Those are entirely different mechanisms requiring entirely different corrective actions.
The economics are usually misunderstood
Companies routinely reject investments in instrumentation because the payback period appears unattractive in quarterly reporting cycles.
Meanwhile, they tolerate chronic instability that quietly consumes money through scrap, sorting activity, downtime, warranty exposure, accelerated wear, and lost throughput.
Armand Feigenbaum described this decades ago through the concept of the hidden plant.
In many operations, a substantial portion of productive effort is spent correcting problems created internally by variation and poor quality.
The following case, which we are all familiar with, demonstrates this clearly. One supplier had operators manually compensating for dimensional drift so frequently that the process effectively depended on tribal knowledge rather than documented control logic.
The line was technically automated, but its stability still relied on a handful of experienced technicians who could “feel” when the process was moving out of condition.
When those technicians retired, performance deteriorated rapidly.
Before launching another improvement programme
Modern manufacturing talks constantly about digital transformation, smart factories, AI-driven optimisation, and Industry 4.0.
Yet many facilities still operate with incomplete sensor validation, poorly characterised uncertainty, inconsistent calibration discipline, and process variables selected mainly because they were historically available.
No predictive algorithm can compensate for fundamentally poor measurement architecture.
Before launching another improvement initiative, it is worth asking a few uncomfortable questions internally:
- Are we monitoring variables because they genuinely govern failure behaviour, or because they were easy to instrument ten years ago?
- When was the last time the measurement system itself was challenged rigorously under operating conditions rather than laboratory conditions?
- Do our control strategies account for drift, autocorrelation, thermal memory, and gradual degradation, or only abrupt excursions?
- How much operational “stability” is actually sustained by undocumented human compensation?
Many organisations discover, sometimes painfully, that the process was never as controlled as the reports suggested.
The data looked clean. The physics underneath it did not.